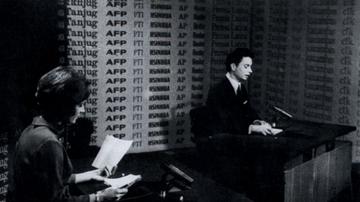


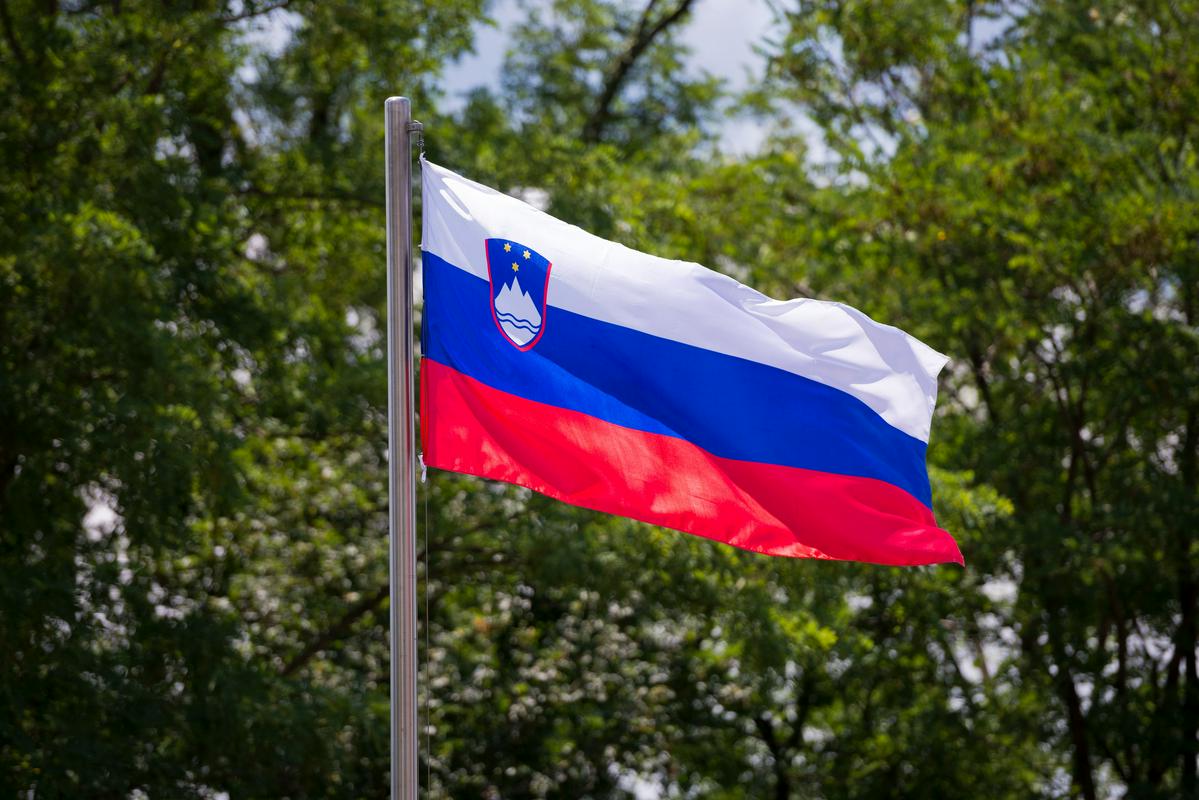
25 July is the Statehood Day in Slovenia. On this day in 1991 Slovenia became formally independent by adopting the Declaration of Independence and the Basic Constitutional Charter on the Sovereignty and Independence of the Republic of Slovenia. Two days later, on 27 June 1991, the Yugoslav People’s Army attacked and the ten-day independence war started.
Twenty-seven years later we can examine what changed in the meantime. At the very start Slovenia was faced with great economic problems, which were successfully overcome. Of course, they were not solved forever; in 2008 the great economic crisis started, but it, too, was successfully overcome.
Economy
In 1991 the Slovenian economy was faced with the loss of the Yugoslav market and the introduction of the market economy. In the first years of independence Slovenia was battling high inflation: in 1991 it was almost 250% and did not fall below 10% until 1995. In 2015 and 2016 Slovenia recorded a deflation (–0.5% and –0.1%, respectively), while in 2017 inflation stood at 1.4%.
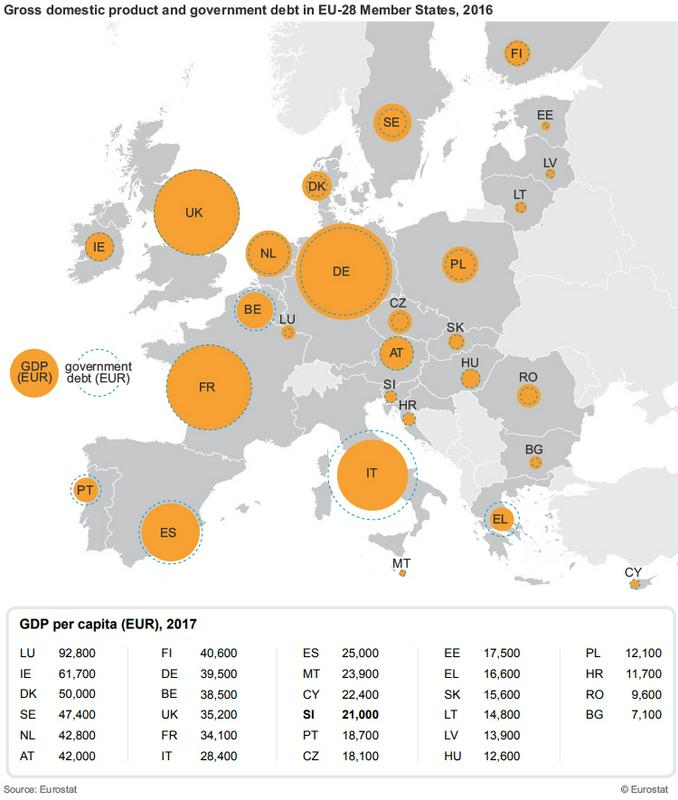
Gross domestic product per capita in 1991 was four times lower than in 2017; in 1991 it was EUR 5,100 and in 2017 EUR 21,000. In the first two years of independence economic activity declined strongly: in 1991 real GDP dropped by 8.9% and in 1992 by 5.5%. In 2017 Slovenia was 16th in the EU-28 as regards GDP per capita. GDP was the highest in Luxembourg (EUR 92,800) and the lowest in Bulgaria (EUR 7,100).
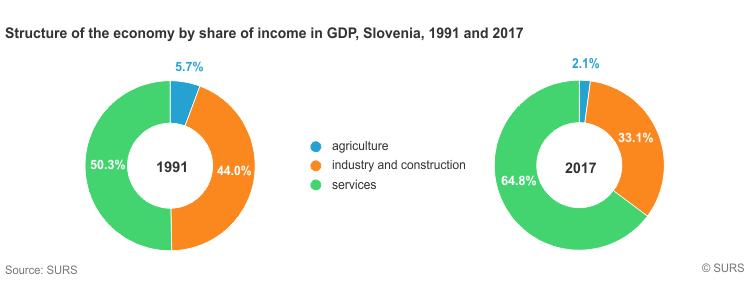
Since 1991 the structure of economy has changed significantly. The share of income from agricultural activity in GDP declined between 1991 and 2017 by more than a half, i.e. from 5.7% (1991) to 2.1% (2017). The share of industry and construction also declined; in 1991 these two activities generated 44% of GDP and in 2017 33.1%. On the other hand, the share of services jumped from 50.3% (1991) to 64.8% (2017). Similar changes were experienced by other countries.
Exports and imports
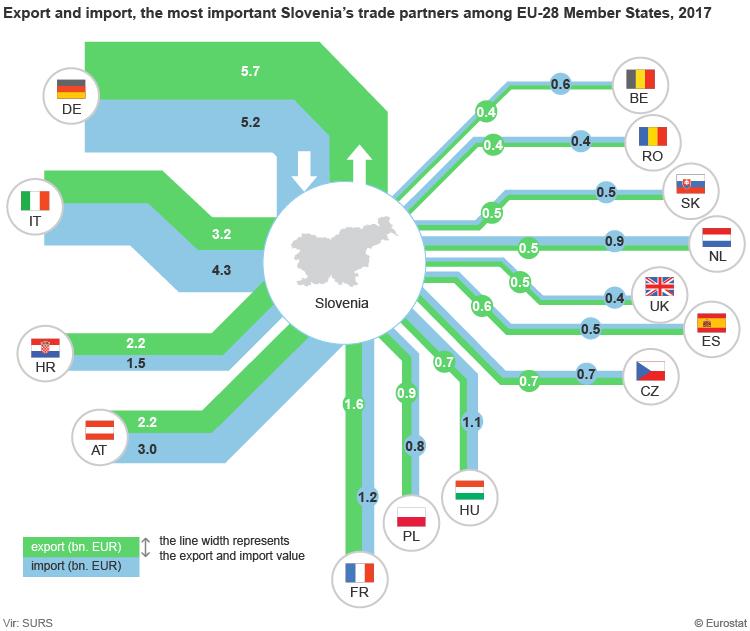
Changes in the economy reflect in Slovenia’s external trade. In 1992 the main export goods were road vehicles (11% of exports), followed by articles of apparel and clothing accessories (10%) and electric machinery and apparatus (9%). In 2017 the largest share of export was generated by road vehicles (16%), followed by electric machinery and apparatus (10%) and medicinal and pharmaceutical products (also 10%).
In all these years Slovenia’s most important trading partner was Germany. As regards other EU Member States, trading increased the most with Austria. As regards EU non-member countries, Slovenia exported most goods to countries established on the territory of former Yugoslavia. After 1991 Slovenia’s exports to the Russian Federation increased, more significantly after the onset of the economic and financial crisis in 2008. Imports from China increased significantly; in 1992 they represented 0.3% and in 2017 3.1% of total Slovenia’s imports. In 2016 over a fifth of importers were trading with China. More companies in Slovenia are trading only with Italy, Germany and Austria.
Tourism
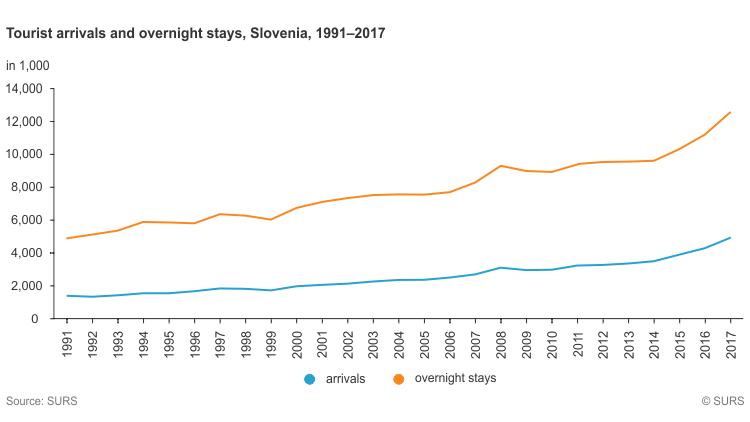
In 1991 1.4 million and in 2017 4.9 million tourist arrivals were recorded in Slovenia. The average number of nights per tourist is declining; in 1991 a tourist spent on average 3.4 nights and in 2017 2.5 nights.
Most overnight stays of foreign tourists in Slovenia in 2017 were from Italy (14% of overnight stays), followed by Germany (12%), Austria (11%), the Netherlands and Croatia (5% each), the United Kingdom and Hungary (4% each).
Tourists from non-European countries generated 13% of foreign overnight stays in Slovenia in 2017. Compared to 2016, the number of tourists from China increased the most (by 37%), followed by the Republic of Korea (by 31%), Canada (by 26%), Australia (by 23%), the United States (by 21%) and Japan (by 11%). Fewer overnight stays than in 2016 were generated by tourists from Israel (by 17%).
Gross fixed capital formation and current expenditure for environmental protection also show that our attitude towards the environment is improving; their shares in GDP were increasing for 15 years (capital formation to 1.15% of GDP and current expenditure to 1.3% of GDP in 2015), while in 2016 they decreased (capital formation to 0.52% of GDP and current expenditure to 1.25% of GDP).
Changes are also observed in food production: in 2000 there were 115 organic farms and in 2016 2,933.
Demography
Slovenia is getting older. On 1 January 1991 the mean age of Slovenia’s population was 35.9 years and on 1 January 2018 43.2 years. In 1991 almost 21% of the population was younger than 15, while at the beginning of 2018 the share was almost 6 percentage points lower at 15%. The situation regarding people aged 65+ is the opposite: in 1991 the share was almost 11% and in 2018 more than 19%. What does that mean?
Fewer pupils, more retired people
The result of the changed demographic situation is on the one hand smaller enrolment in elementary schools. In the school year 2017/18 there were almost 44,000 fewer elementary school pupils than in the school year 1991/92. The number of children enrolled in elementary school has been slightly increasing since 2011, which is a result of the increased number of births between 2004 and 2010.
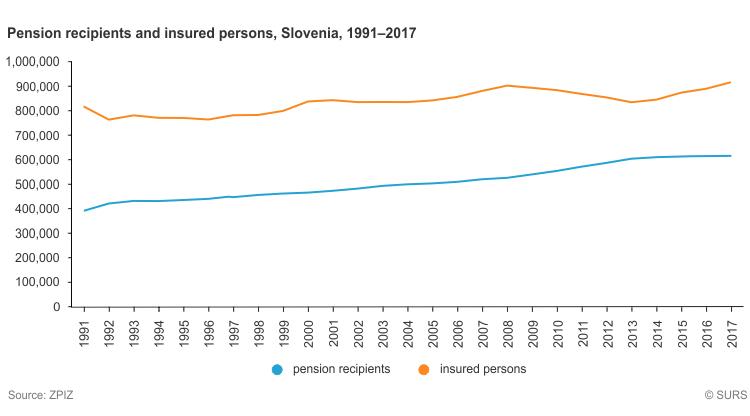
On the other hand, the number of retired persons is increasing, the ratio between insured persons and retired persons is changing. In 1991 there were fewer than 400,000 retired persons (persons receiving old age, disability, survivor’s or widow(er)’s pensions); by 2017 the number increased to 616,000. In 1991 the ratio between insured persons and retired persons was 2.0 and in 2017 1.49. In other words, in 2017 there was less than one and a half insured person (included in compulsory or voluntary pension insurance) per one retired person. The ratio between earnings and pensions is also getting worse. In 1992 average net pensions were 78.4% of average net earnings; in 2017 only 58.4%.
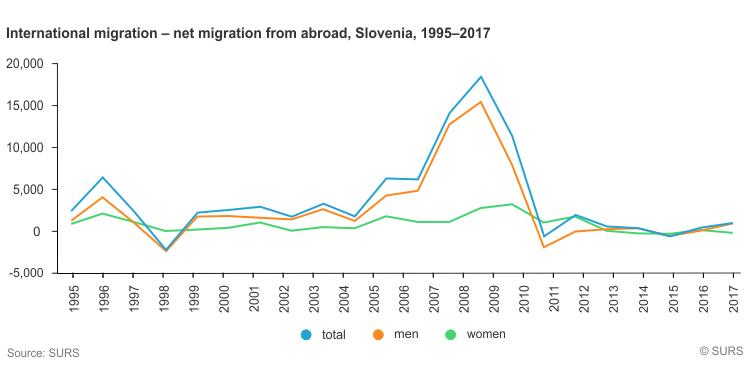
International migration
Most people immigrated to Slovenia in 2007, 2008 and 2009 (about 30,000 per year). At that time many work permits for foreign nationals were issued. Since 2010 between 14,000 and 17,000 people per year have immigrated to Slovenia. From 2006 on between 12,000 and 16,000 people per year have emigrated from Slovenia, most in 2009 (19,000).
Health
There are no accurate data on the health status of the population, but we have data on the self-assessment of the health status: in the survey people were asked about their overall health status, i.e. physical, social and emotional. In 2005–2017 self-assessment improved. In 2017 almost two thirds of respondents assessed their health status as good or very good.
Compared to 1991 people are living longer. In 1991 the mean age at death was 70 years and in 2017 almost 8 years more. Girls born in Slovenia in 2017 can expect to live 83.7 years and boys just over 78 years.
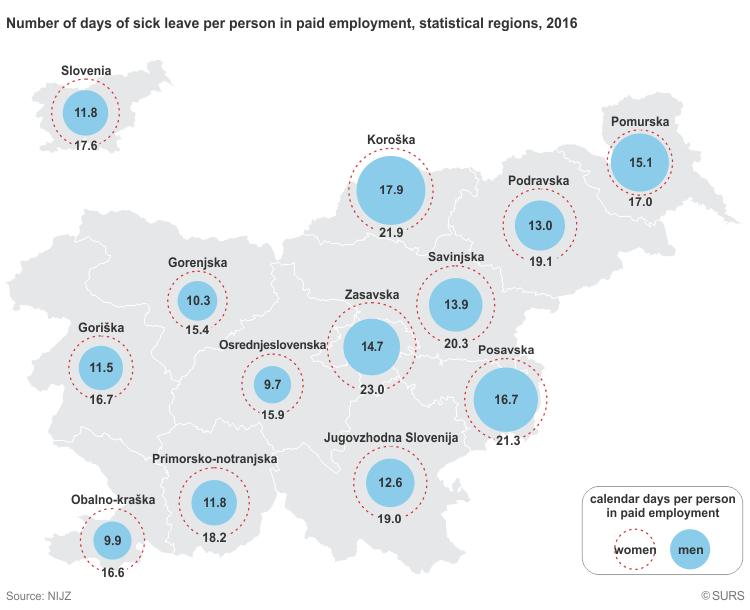
In 2016 the sick leave rate was 4%, lower than ten years ago. The average duration of one sick leave declined from 17.9 calendar days in 2007 to 14.6 calendar days in 2016. In 2016 men recorded most sick leave days in the Koroška statistical region (17.9) and women in the Zasavska statistical region (23).
Persons in employment and unemployed persons
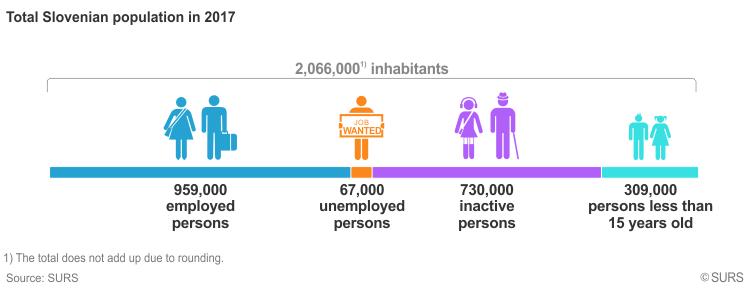
There were 1,027,000 working age people in Slovenia in 2017, 959,000 of them in employment and 67,000 unemployed. The LFS unemployment rate was 6.6%, for men 5.8% and for women 7.5%. The employment rate was 54.6%, for men 59.5% and for women 49.8%.
The unemployment rate in 2017 was lower than in 2016 in all statistical regions. It was the lowest in Koroška and Posavska (4.3%) and the highest in Pomurska (9.6%) and Obalno-kraška (8.1%). In the same comparison the activity rate increased in all statistical regions. In 2017 it was the highest in Podravska (58%) and the lowest in Pomurska (51.7%).
Earnings
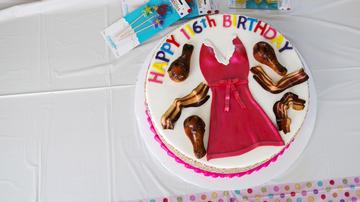
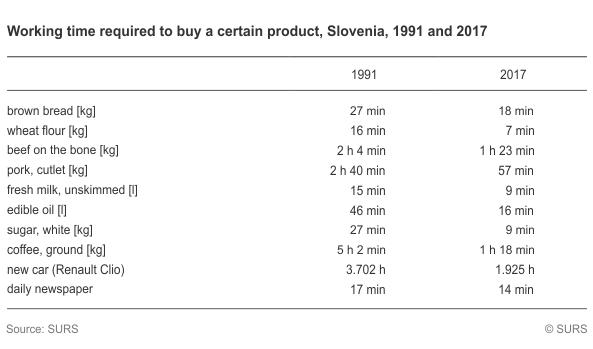
A resident of Slovenia born at the end of the 1980s had to change three currencies and four types of banknotes before completing their 18th birthday. With independence in 1991 Yugoslav dinars were replaced by Slovenian tolars, which were first printed as provisional payment notes and only later replaced by real banknotes. In 2017 tolars (SIT) were replaced by euros (EUR). A comparison of average earnings in the past twenty years is therefore hardly possible. We can see, however, that since 1991 the prices have increased less than the earnings.
One can learn more from the data on how much time one had to work to buy a certain good or service in 1991 and in 2017. To buy a kilo of brown bread, in 2017 one had to work a third less than in 1991. For a kilo of sugar one had to work three times less, for a kilo of coffee four times less and for a new Renault Clio two times less than 26 years ago.
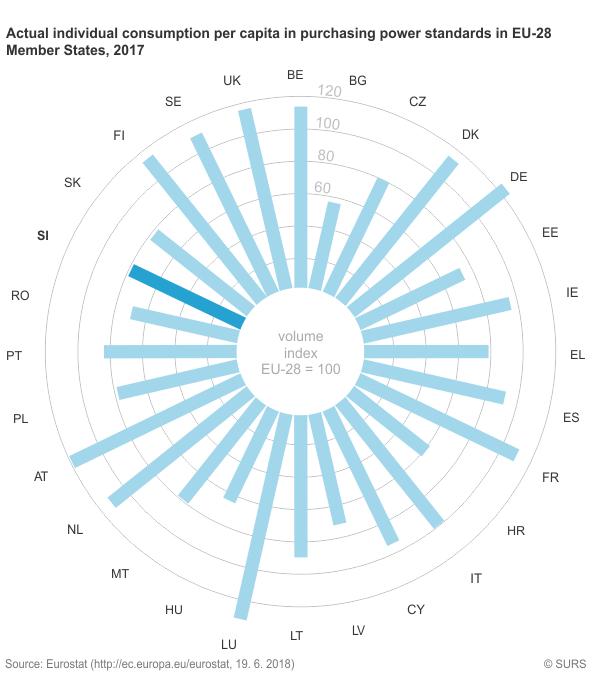
Actual individual consumption
Actual individual consumption per capita in purchasing power standards is the most important part of gross domestic product and reflects the material well-being of the population. It is calculated on the basis of the prices of goods and services actually consumed by individuals. In 2017 actual individual consumption per capita in purchasing power standards in Slovenia lagged behind the EU-28 average by 23%. Closest to Slovenia were Greece (also 77% of EU-28 average), Malta (78%), and Poland and Slovakia (76% each).
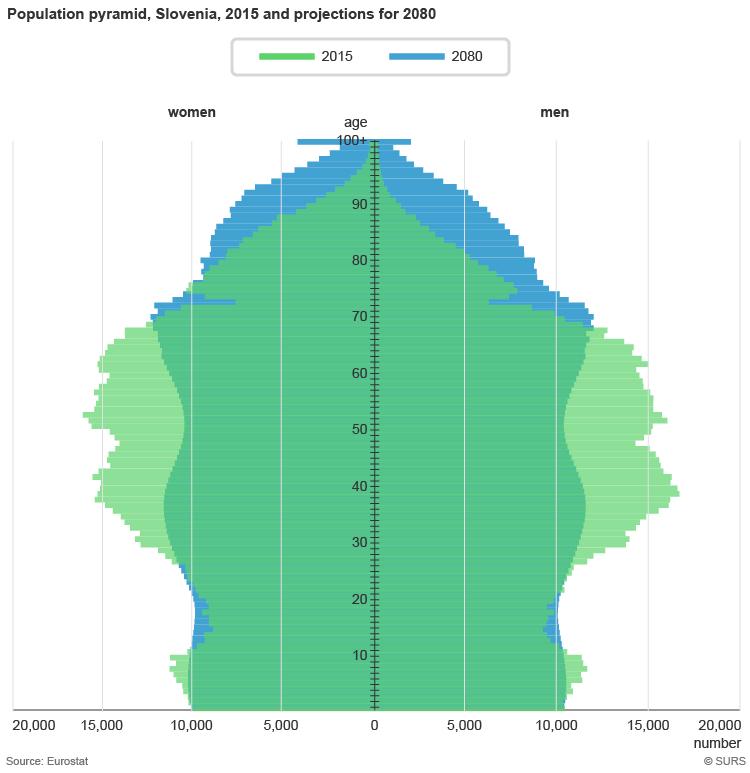
What is the outlook?
The population of Slovenia is expected to be increasing by about 2025 (to around 2,083,000), mostly on account of positive net migration. Natural increase in 2017 was negative for the first time after 2005. After 2025 the population is expected to slowly decline. On 1 January 2080 Slovenia is expected to have 1,938,000 residents, 6% fewer than in the starting year of projections, i.e. in 2015.
In the next 65 years the age structure of Slovenia’s population is expected to change drastically. In 2018, 19.4% of the population is aged 65+. By 2057 the share is expected to increase to almost 31%. Life expectancy at birth will increase; boys born in Slovenia in 2080 could expect to live 87 years and girls more than 91 years.